- IELTS WRITING TASK 1
Employment Distribution by Sector (2021)
You should spend about 20 minutes on this task.
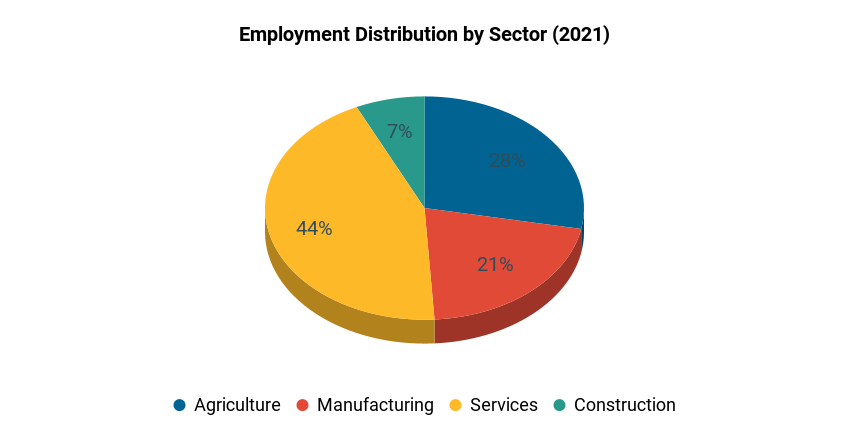
The chart below provides information about the percentage distribution of employment in various sectors in a country in the year 2021. Summarize the data and identify any notable trends or comparisons.
Write at least 150 words describing the information in the chart. Highlight key points and trends evident in the employment distribution.

Sample Answer, C1 English Level, Advanced, Band Score 6.5-7.5
The chart gives us insights into how people in a country were employed across different sectors in 2021. The majority, 44%, were engaged in the services sector, which could include jobs like banking, healthcare, or hospitality. Agriculture followed at 28%, showing that a significant portion of the population still worked in farming and related activities. Manufacturing accounted for 21%, suggesting the country’s industrial base remained substantial. Construction claimed the smallest slice, at 7%, possibly due to its labor-intensive nature.
Comparing the sectors, services and agriculture together employed about 72% of the workforce, underlining the importance of both advanced and traditional industries. Notably, the service sector held the largest share, indicating a shift towards a more service-oriented economy. Conversely, construction had the smallest share, possibly reflecting its relatively limited job opportunities. In conclusion, the data unveils a diverse employment landscape, where services dominate, followed by agriculture and manufacturing, with construction trailing behind.
Essay:
The chart provides information about how people were employed in different sectors in a country during 2021. The largest number of people, 44%, had jobs in the services sector, which includes things like banking and hospitality. Agriculture was the next biggest employer at 28%, showing that many people still worked in farming. Manufacturing provided jobs for 21% of the workforce, suggesting that there were quite a few jobs in making things. The smallest number of people, 7%, worked in construction.
When we look at the comparison between sectors, we can see that services and agriculture together employed 72% of the workforce, which is quite a lot. Services were the biggest employer, showing that many people were working in jobs that provide services to others. On the other hand, construction was the smallest employer, perhaps because it requires specialized skills. To sum up, the data tells us that in 2021, most people in the country worked in services and agriculture, with services being the largest sector of employment.
Essay:
The provided chart offers an overview of employment distribution across various sectors within a country for the year 2021. Notably, the services sector stands out as the primary source of employment, engaging 44% of the workforce. This sector encompasses diverse fields like banking, healthcare, and hospitality. Following closely is the agriculture sector, employing 28% of individuals, indicating a substantial reliance on traditional farming activities. Manufacturing represents a significant sector as well, contributing to 21% of employment, highlighting the nation’s industrial capacity.
Conversely, the construction sector employs the smallest percentage, comprising 7% of the workforce. When considering sectoral comparisons, services and agriculture collectively employ a substantial 72% of the workforce, showcasing the coexistence of modern and traditional employment avenues. The services sector’s dominance signifies the country’s shift towards service-oriented economic activities. The limited engagement in the construction sector could stem from specialized skill requirements.
In conclusion, the data portrays a diverse employment landscape, with services taking the lead, followed by agriculture and manufacturing, while construction maintains a more limited role.

