- IELTS WRITING TASK 1
Household Expenditure in the UK (2020)
You should spend about 20 minutes on this task.
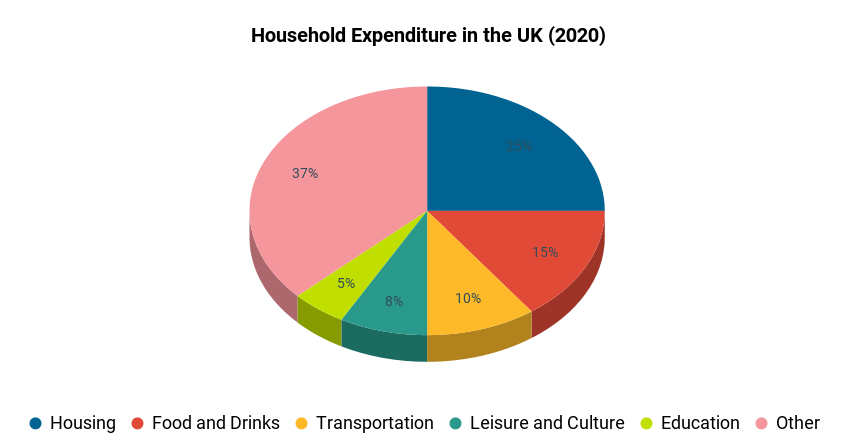
The chart below shows the percentage of household income spent on various categories in the United Kingdom in 2020.
Write a report for a university lecturer describing the main trends and differences in spending patterns.
Write at least 150 words. Include comparisons where relevant.

Sample Answer, C1 English Level, Advanced, Band Score 6.5-7.5
The chart provides an overview of how households in the UK allocated their income across different categories in the year 2020. Housing took up the largest chunk, accounting for 25% of the income, indicating its significance in people’s budgets. Food and drinks followed at 15%, reflecting its essential nature but being less substantial than housing. Transportation and leisure activities claimed 10% and 8% respectively, suggesting that people were willing to allocate a reasonable portion of their income to these aspects of their lives. Education expenses accounted for 5%, indicating a commitment to personal and family growth. The remaining 37% was allocated to other miscellaneous expenses, which might include things like health, personal care, and savings.
Interestingly, the figures reveal that housing and food are the major expenses, together constituting 40% of the household income. On the other hand, education and leisure combined were just 13%, indicating a higher priority for basic needs. The relatively small portion allocated to transportation and leisure might imply that people were cautious with non-essential spending due to economic factors or changing lifestyles influenced by the pandemic. To conclude, the table portrays a balanced picture of how households distributed their income, with housing and food taking the forefront, while leisure and education were managed with slightly lesser shares.
Essay:
The chart shows how people in the UK spent their money in different areas in 2020. The biggest expense was housing, using 25% of their income. This makes sense because everyone needs a place to live. Food and drinks came next, at 15%, which is normal because we all need to eat. Transportation and things like buses or cars used 10% of their money. Leisure and culture, like going to movies or museums, used 8%, and education was at 5%, probably for schools and learning. The rest, 37%, was for other stuff that wasn’t mentioned.
What’s interesting is that housing and food together used the most money, around 40%. Education and fun things like leisure together used less money, about 13%. This means that people cared more about having a place to live and food to eat, which are basic needs. Maybe they didn’t spend much on fun or education because of the situation in 2020, like the pandemic. Overall, it shows that people in the UK tried to balance their money between important things like housing and food, and other things like fun and learning.
Essay:
The chart outlines the distribution of household expenditure across various categories in the UK for the year 2020. Notably, housing expenses commanded the largest share, accounting for a quarter of the income. This substantial allocation underscores the paramount significance of securing a residence. Following closely, food and beverage expenses claimed 15%, reflective of the inherent necessity of sustenance.
Transportation expenses constituted 10%, indicating a reasonable commitment to mobility. Leisure and cultural pursuits accounted for 8%, suggesting a balanced approach to recreational activities. Education expenses were at 5%, underlining a commitment to personal and intellectual development.
Interestingly, the collective expenditure on housing and food was substantial, representing around 40% of the household income. This highlights the prioritization of basic necessities. Conversely, the allocation for education and leisure pursuits, though important, was comparatively lower, constituting about 13%. This might be attributed to factors such as the prevalent economic climate and the influence of the pandemic on lifestyle choices.
In essence, the data portrays a judicious distribution of income, with a significant focus on fundamental needs like housing and sustenance, while allowing room for educational and leisurely pursuits, albeit to a slightly lesser extent.

