- IELTS WRITING TASK 1
Household Expenses Distribution
You should spend about 20 minutes on this task.
The chart below presents the distribution of household expenses across different categories in a given month. Write a report summarizing the information and identifying any significant observations.
Write a report of at least 150 words describing the information shown in the chart. Highlight key points and trends evident in the distribution of household expenses.

Sample Answer, C1 English Level, Advanced, Band Score 6.5-7.5
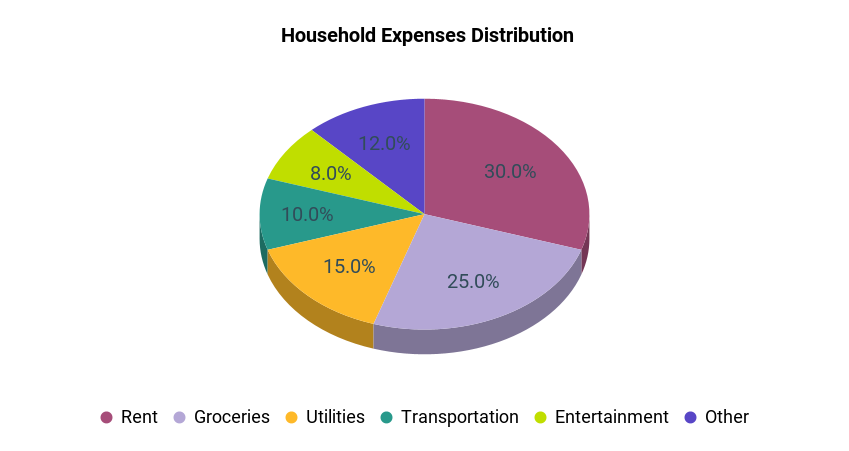
The provided chart outlines the allocation of household expenses across different categories in a particular month. The largest portion of expenses, accounting for 30%, is dedicated to rent, reflecting the significant outlay for accommodation. Groceries come next, constituting 25% of the budget, indicating the importance of food-related costs. Utilities, covering electricity, water, and other services, make up 15% of expenses, showing their significance in the monthly budget.
Transportation expenses account for 10%, which seems reasonable for getting around. Entertainment claims 8%, indicating a portion set aside for leisure activities. The remaining 12% is designated for other miscellaneous expenses.
To summarize, the highest expenditure is on rent, followed by groceries, utilities, transportation, and entertainment. The distribution highlights the prioritization of essential needs like housing and food, while still allowing room for other aspects of life. This snapshot of monthly expenses offers insight into how financial resources are distributed across various aspects of daily living.
Essay:
The chart shows how a household’s expenses are divided across different categories in a month. The biggest part of the budget, 30%, goes towards rent, which is the money paid for living in a home. After that, 25% is spent on groceries, which is money used to buy food and other household items. Utilities like electricity and water make up 15% of the expenses, and 10% is used for transportation, like bus fares or gas for a car. Around 8% is allocated for entertainment, which includes activities like going to the movies or eating out. The rest, 12%, is used for other things that aren’t mentioned.
In conclusion, the majority of the budget is used for necessities like rent and groceries. This tells us that the household prioritizes having a place to live and enough food to eat. The smaller portions for utilities, transportation, and entertainment suggest that these are also important, but not as essential.
Essay:
The provided chart illustrates how a household’s expenses are distributed across different categories over the course of a month. The largest chunk, at 30%, is allocated to covering rent, signifying the substantial cost of accommodation. Following that, groceries claim 25%, indicating a significant portion of the budget is spent on food and household items. Utilities, encompassing electricity and water, constitute 15% of expenses, and 10% is earmarked for transportation, including factors like commuting and fuel.
Entertainment expenses, accounting for 8%, encompass leisure activities such as dining out or going to the cinema. The remainder, which stands at 12%, is dedicated to miscellaneous expenditures. To sum up, the chart reveals a clear emphasis on fundamental needs, with a considerable allocation towards rent and groceries. This pattern underscores the priority of securing housing and sustenance. The distribution across categories offers insight into the household’s financial priorities and highlights the balance maintained between essential and discretionary expenditures.

