- IELTS WRITING TASK 1
International Tourist Arrivals (2018-2019)
You should spend about 20 minutes on this task.
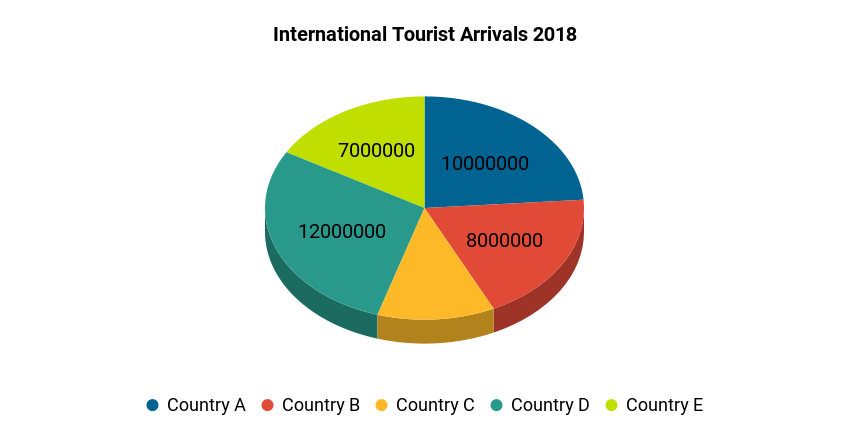
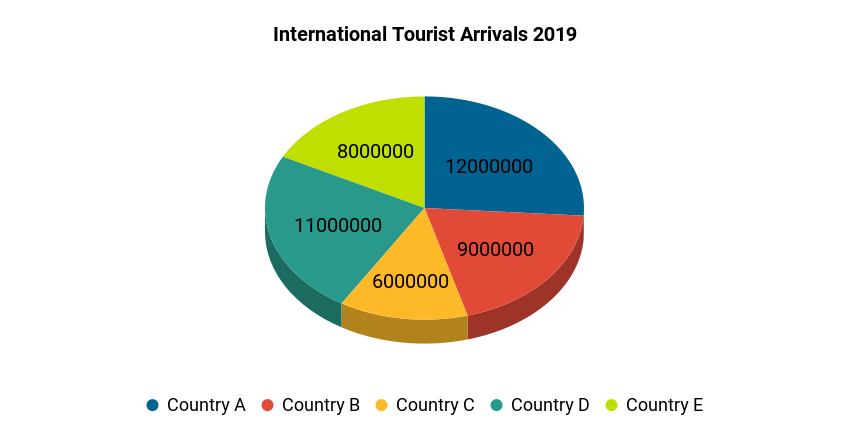
The chart below presents information about the number of international tourists (in millions) visiting five different countries in the years 2018 and 2019. Summarize the data and identify any significant trends or variations.
Write a report of at least 150 words describing the information in the chart. Highlight key points and trends evident in the international tourist arrivals.


Sample Answer, C1 English Level, Advanced, Band Score 6.5-7.5
C1 Level:
The provided chart showcases the influx of international tourists in five distinct countries during the years 2018 and 2019. In 2018, Country D and Country A both attracted 12 million visitors, rendering them the most visited among the nations in question. Country B followed closely with 8 million arrivals, while Country E and Country C recorded 7 million and 5 million tourists, respectively.
Fast forwarding to 2019, some shifts in tourist numbers occurred. Country A saw a slight increase in visitors to 12 million, maintaining its position at the top. Country B’s tourism figures rose to 9 million, and Country D’s count decreased to 11 million. Additionally, both Country C and Country E experienced growth in visitor numbers to 6 million and 8 million respectively.
In conclusion, the data demonstrates a general upward trend in international tourist arrivals across these countries from 2018 to 2019. The fluctuations observed in individual countries highlight the dynamic nature of the tourism industry, influenced by factors like economic conditions, attractions, and global events.
Essay:
The chart presents data on the number of international tourists who visited five different countries in the years 2018 and 2019. In 2018, Country A welcomed 10 million tourists, while Country B had 8 million, Country C had 5 million, Country D had 12 million, and Country E had 7 million visitors.
The trend continued in 2019, where the numbers changed slightly. Country A saw an increase to 12 million tourists, and Country B had 9 million. Country C’s count rose to 6 million, but both Country D and Country E experienced a decrease, with 11 million and 8 million tourists respectively.
In summary, the data indicates that the number of tourists increased or remained fairly consistent for most of these countries from 2018 to 2019. However, some countries saw slight decreases in tourist numbers. Overall, this suggests a stable or growing interest in these destinations, potentially influenced by factors like attractions, economic conditions, or travel trends.
Essay:
The chart provides insights into the international tourist arrivals for five different countries in the years 2018 and 2019. In 2018, Country A and Country D had the highest number of tourists, both at 12 million visitors. Following closely were Country B with 8 million, Country E with 7 million, and Country C with 5 million tourists.
Shifting to 2019, the numbers underwent slight changes. Country A and Country B observed modest increases, reaching 12 million and 9 million tourists respectively. Country D experienced a decline to 11 million visitors, while both Country C and Country E saw growth in tourist numbers to 6 million and 8 million respectively.
In summary, the overall trend suggests a stable to slightly growing interest in these countries from 2018 to 2019. Factors influencing these variations might include economic conditions, attractions, or marketing efforts. It’s important to note that even small changes in numbers can signify shifts in the travel industry and reflect the preferences and choices of international tourists.

