- IELTS WRITING TASK 1
Percentage Distribution of Household Waste Types
You should spend about 20 minutes on this task.
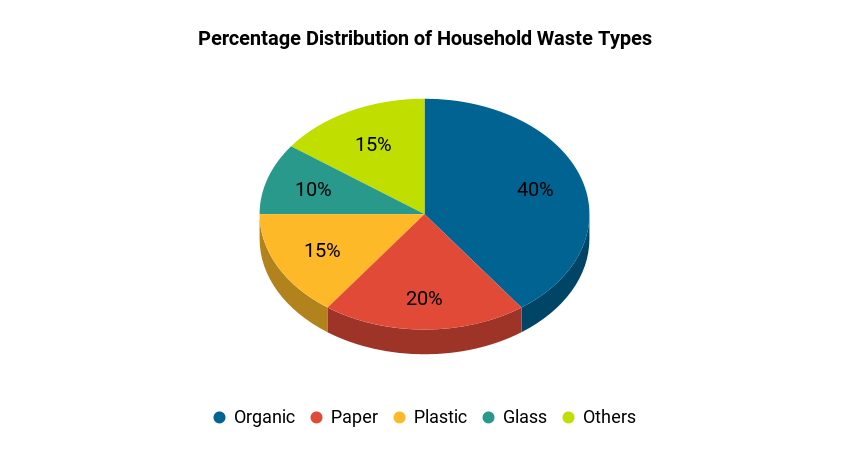
The chart below provides information about the percentage distribution of different types of waste generated by households in a city.
Write a report of at least 150 words describing the information shown in the chart. Analyze the distribution of waste types and discuss any patterns or trends that emerge.

Sample Answer, C1 English Level, Advanced, Band Score 6.5-7.5
The provided chart gives an overview of the distribution of waste types generated by households in a city, represented as percentages. The largest portion, accounting for 40%, is organic waste, which includes things like food scraps and garden waste. Paper waste constitutes 20%, while plastic waste follows at 15%. Glass waste makes up 10% of the total waste, and other miscellaneous waste types account for the remaining 15%.
From the chart, we can discern that organic waste holds the highest share, suggesting a substantial amount of biodegradable waste being produced. The presence of paper and plastic waste is also noteworthy, indicating the impact of packaging materials and paper products. Surprisingly, glass waste occupies a smaller proportion in comparison.
In conclusion, the chart reflects the composition of waste types in the city’s households, highlighting the dominance of organic waste, followed by paper and plastic. This data underscores the importance of sustainable waste management strategies, especially with regards to organic and non-biodegradable waste.
Essay:
The chart illustrates the breakdown of waste types generated by households in a city, presented as percentages. The largest portion, constituting 40%, is organic waste, encompassing food and garden-related waste. Paper waste follows at 20%, indicating the prevalence of paper products in households. Plastic waste accounts for 15%, highlighting the impact of plastic packaging. Glass waste makes up 10% of the total, while other miscellaneous waste types contribute 15%.
From the chart, we can deduce that organic waste is the dominant waste type, underscoring the significance of proper composting and waste management. Paper and plastic waste are also substantial, reflecting consumer habits related to packaging and paper products. Glass waste, although a smaller proportion, remains a notable component of household waste.
To conclude, the chart portrays the distribution of waste types in the city’s households, emphasizing the importance of waste reduction strategies, recycling, and conscious consumption practices to mitigate the environmental impact of various waste materials.
Essay:
The provided chart offers insights into the composition of waste types generated by households in a city, depicted in percentages. The largest share, constituting 40%, is organic waste, encompassing biodegradable materials like food scraps and green waste. Paper waste follows at 20%, indicating the presence of paper-based products in household consumption. Plastic waste constitutes 15%, highlighting the environmental impact of plastic usage. Glass waste accounts for 10% of the total, while other miscellaneous waste types contribute to the remaining 15%.
The chart underscores the prominence of organic waste, signaling the need for efficient composting and waste management strategies. The significant portions of paper and plastic waste reflect consumer behaviors concerning packaging and single-use items. The modest percentage of glass waste is a notable observation.
In conclusion, the chart provides an overview of waste composition, indicating the pressing need for sustainable practices and awareness to minimize the impact of different waste types on the environment. It highlights the importance of promoting recycling, reducing single-use plastics, and fostering responsible waste disposal habits to create a more sustainable future.

