- IELTS WRITING TASK 1
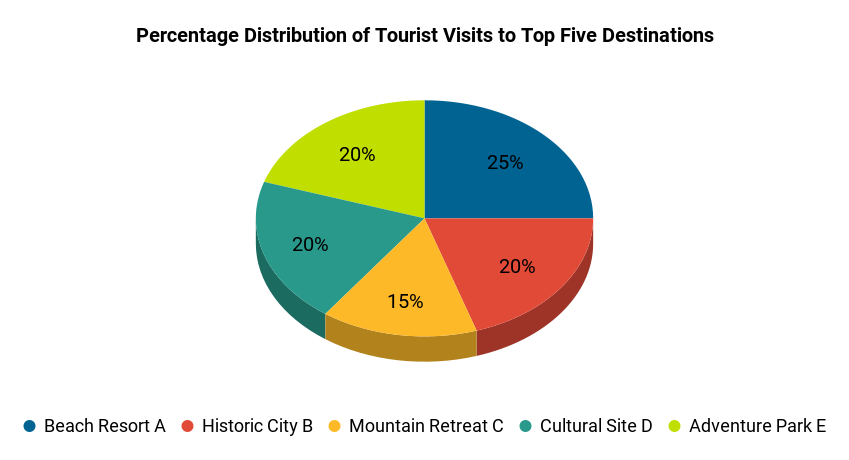
Percentage Distribution of Tourist Visits to Top Five Destinations
You should spend about 20 minutes on this task.
The chart below provides information about the percentage distribution of tourist visits to the top five popular destinations in a country.
Write a report of at least 150 words describing the information shown in the chart. Analyze the distribution of tourist visits and discuss any patterns or trends that emerge among the top five destinations.

Sample Answer, C1 English Level, Advanced, Band Score 6.5-7.5
The presented chart unveils the distribution of tourist visits to the top five sought-after destinations within a certain country, conveyed in percentages. Beach Resort A captures the largest share with 25%, making it the most popular spot. Following closely is Historic City B, attracting 20% of tourist visits. Mountain Retreat C and Cultural Site D each draw 15% and 20% of visitors respectively, showing a balanced interest. Adventure Park E wraps up the list with 20%, indicating its appeal.
From the chart, we can discern that the Beach Resort and the Cultural Site share a similar level of interest, both having 25% of the visitors. Moreover, the Historic City and Adventure Park have equivalent popularity, each attracting 20% of tourists. The Mountain Retreat, while being a serene option, still boasts a considerable 15% of visitors.
In conclusion, the chart provides an insightful glimpse into the distribution of tourist visits among the top five destinations. This information suggests a diverse array of attractions catering to varied preferences, ensuring that travelers can find experiences aligned with their interests.
Essay:
The chart displays the breakdown of tourist visits to the top five destinations in a country, presented as percentages. The Beach Resort A takes the lead with 25% of tourists choosing it as their destination. Historic City B follows closely with 20%, while Mountain Retreat C and Cultural Site D each attract 15% of visitors. Adventure Park E wraps up the list with 20% of tourists.
From the chart, it’s evident that Beach Resort A is the most popular destination among tourists, with Historic City B also being a significant choice. Adventure Park E and Cultural Site D share similar levels of popularity, both attracting 20% of visitors. The Mountain Retreat C, though peaceful, still manages to capture 15% of tourists.
In conclusion, the chart provides an overview of tourists’ preferences among the top five destinations. It shows a variety of attractions, indicating that travelers have diverse interests. This information is helpful for understanding which places hold the most appeal and ensuring a well-rounded tourism experience in the country.
Essay:
The presented chart illustrates the distribution of tourist visits among the top five destinations in a country, depicted as percentages. The Beach Resort A emerges as the most preferred destination, with a quarter of tourists (25%) opting for it. Historic City B follows closely with 20% of tourists, signifying its strong appeal. Meanwhile, both Mountain Retreat C and Cultural Site D share a 15% portion of visitors, indicating comparable interest. Adventure Park E concludes the list, attracting 20% of tourists.
From the chart, it’s evident that while Beach Resort A is the leading choice, other destinations also hold considerable appeal. Adventure Park E and Cultural Site D share similar popularity, each garnering a fifth of the total visits. Additionally, the balanced distribution among Mountain Retreat C and Historic City B showcases diverse tourist preferences.
In summary, the chart provides valuable insights into tourists’ preferences for the top five destinations. This data underscores the importance of offering a range of attractions to cater to various interests, contributing to a well-rounded tourism experience and ensuring a thriving tourism sector within the country.

