- IELTS WRITING TASK 1 -LINE GRAPH & BAR CHART
Pet Preferences and Age Distribution in the Community
You should spend about 20 minutes on this task.
Task:
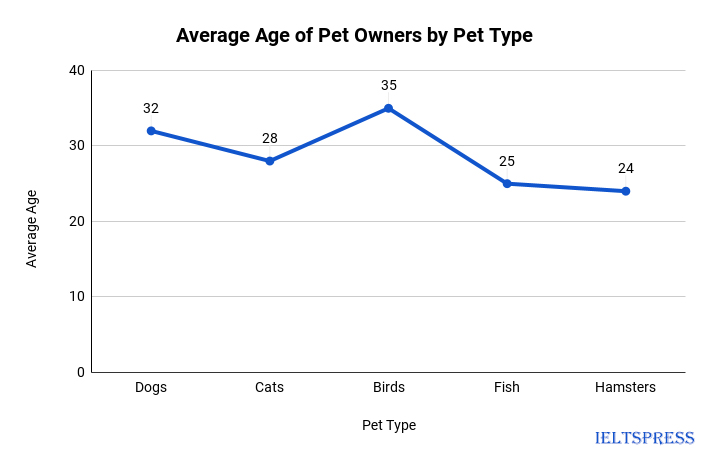
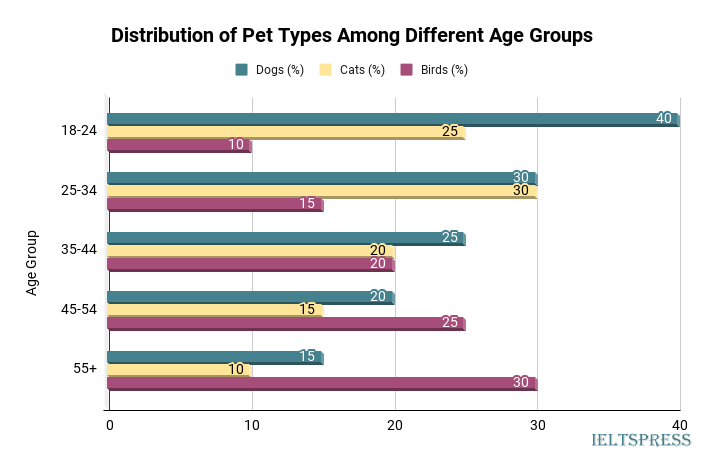
The data provided delves into the preferences for different types of pets among individuals in a community. The line graph illustrates the average age of pet owners, while the accompanying bar chart showcases the distribution of pet types favored by various age groups. Summarize the trends and key observations from the line graph and bar chart.
Write at least 150 words describing the main trends and comparisons shown in the graphs.


Sample Answer, C1 English Level, Advanced, Band Score 6.5-7.5
The graphs provide insights into people’s choices of pets in relation to their age groups. The line graph showcases the average age of pet owners for different types of pets, while the bar chart gives us a glimpse into the preferred pet types within various age ranges.
Examining the line graph, we can discern that the age of pet owners varies across different pet types. Bird owners tend to be the oldest, with an average age of 35 years. On the other hand, fish and hamster owners are younger, with average ages of 25 and 24 years respectively. Cat and dog owners fall in between, with average ages of 28 and 32 years.
Moving on to the bar chart, it’s clear that pet preferences evolve as people grow older. The 25-34 age group displays a liking for both cats and dogs, showcasing a balanced preference. As people age further, specifically in the 45-54 and 55+ age groups, they lean towards dogs and birds as their favored pet choices.
In conclusion, the graphs elucidate the connection between age and pet preferences. The line graph outlines how average ages differ for various pet types, while the bar chart underscores the evolving preference trends among different age groups.
The graphs offer insights into how people of different ages prefer certain types of pets. The line graph presents the average ages of pet owners for different pets, while the bar chart shows the favored pet types across age groups.
From the line graph, it’s clear that the age of pet owners varies based on the type of pet. People who own birds tend to be older, around 35 years old. Fish and hamster owners are younger, with averages of 25 and 24 years respectively. Cat and dog owners fall in between, with ages around 28 and 32.
Looking at the bar chart, we can see that as people age, their pet preferences change. The 25-34 age group likes both cats and dogs equally. In contrast, the 45-54 and 55+ age groups show a stronger inclination towards dogs and birds. This suggests that pet preferences evolve with age.
In conclusion, the graphs highlight how pet choices are linked to age. The line graph gives insight into different age groups for various pets, while the bar chart underlines how pet preferences change as people get older.
The provided graphs unveil intriguing patterns in people’s pet preferences across various age brackets. The line graph vividly portrays the average age of pet owners for distinct pet types, while the accompanying bar chart artfully delineates the spectrum of favored pets within different age groups.
Upon analyzing the line graph, it’s discernible that the choice of pet is intertwined with age. Those who own birds tend to be of a more mature age, averaging around 35 years. Meanwhile, individuals with fish and hamsters as pets are comparatively younger, with average ages of 25 and 24 years, respectively. Cat and dog owners fall in the middle range, with ages ranging from 28 to 32.
Turning to the bar chart, an interesting narrative unfolds as age advances. The 25-34 age segment demonstrates an equal fondness for both cats and dogs, a notable harmony in preferences. As the years progress, the 45-54 and 55+ age groups distinctly gravitate towards dogs and birds as their preferred companions. This dynamic shift suggests a correlation between age and pet inclination.
In conclusion, the graphs provide captivating insights into the interplay between age and pet choices. The line graph paints a vivid portrait of diverse average ages across pet types, while the bar chart elucidates the evolving preferences that accompany different stages of life.

