- IELTS WRITING TASK 1 -LINE GRAPH & BAR CHART
Pursuits of Leisure: Hobbies and Age Group Analysis
You should spend about 20 minutes on this task.
Task: The data at hand reveals the assortment of hobbies individuals engage in across varying age groups. The line graph portrays the average number of hours spent on hobbies per week, while the accompanying bar chart illustrates the allocation of different hobbies among distinct age categories. Summarize the trends and noteworthy observations gleaned from the line graph and bar chart in your response.
Write at least 150 words describing the main trends and comparisons shown in the graphs.


Sample Answer, C1 English Level, Advanced, Band Score 6.5-7.5
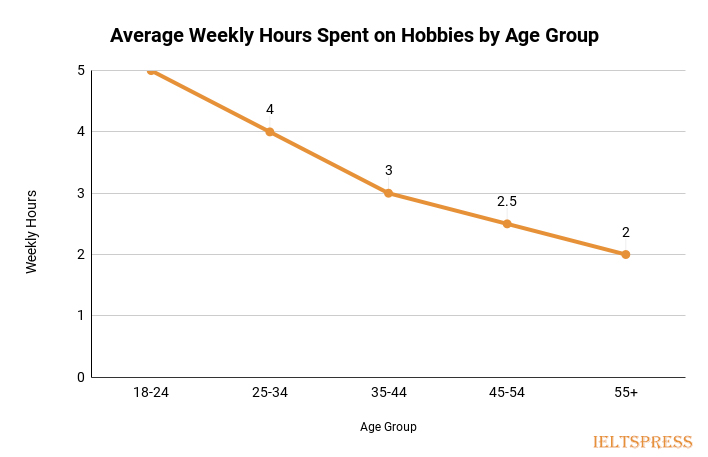
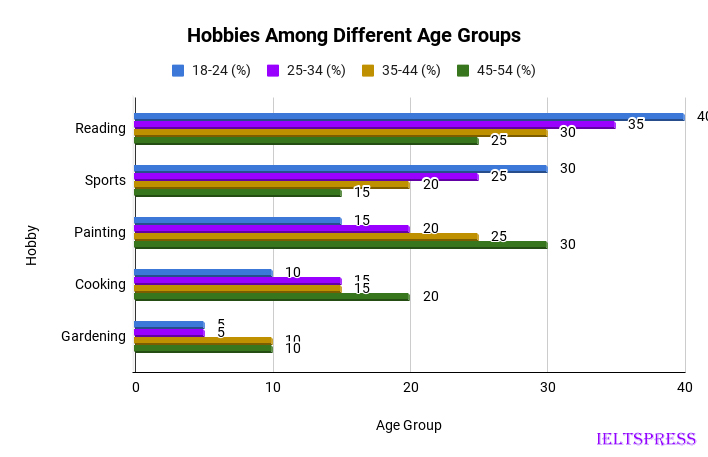
The graphs provide insights into people’s hobbies and how they change with age. The line graph displays the average weekly hours individuals spend on hobbies, while the bar chart shows the types of hobbies preferred by different age groups.
Looking at the line graph, we can see that younger people, aged 18-24, devote more time to hobbies, spending around 5 hours per week. As age increases, the time spent on hobbies gradually declines, with those aged 55 and above dedicating about 2 hours per week.
Focusing on the bar chart, we observe that reading is a popular hobby across all age groups. Sports is more favored by younger people, while painting becomes increasingly appealing as age advances. Cooking and gardening gain significance among the older age groups.
In conclusion, the graphs highlight the connection between age and hobbies. The line graph illustrates how weekly hobby time decreases as people grow older. The bar chart demonstrates the diverse preferences in hobbies across different age groups, with reading and sports being popular among the younger, and painting, cooking, and gardening resonating more with the older generation.
The graphs give us an understanding of people’s hobbies and how they vary with age. The line graph reveals the average hours spent on hobbies every week, while the bar chart displays the kinds of hobbies that different age groups prefer.
From the line graph, we can see that younger individuals, aged 18-24, invest around 5 hours per week in hobbies. As people get older, the time spent on hobbies decreases gradually, with those aged 55 and above spending about 2 hours each week.
Turning to the bar chart, we notice that reading is a popular hobby across all age ranges. Sports appeals more to younger people, whereas painting gains favor as age increases. Additionally, cooking and gardening become more attractive to the older age groups.
In summary, the graphs show how age influences hobbies. The line graph highlights a decrease in weekly hobby time with increasing age. Meanwhile, the bar chart emphasizes the diversity of hobby choices across age groups, where reading and sports capture the attention of the younger generation, while painting, cooking, and gardening resonate more with the older individuals.
The data in the graphs provides an intriguing glimpse into the hobbies embraced by individuals, revealing a correlation with age. The line graph visually narrates the average number of hours dedicated to hobbies on a weekly basis, while the accompanying bar chart skillfully unravels the spectrum of hobbies favored by different age groups.
A closer look at the line graph underscores a clear pattern: the younger age bracket of 18-24 invests a substantial 5 hours per week in hobbies. This commitment gradually diminishes with age, reaching a modest 2 hours for those aged 55 and above.
The bar chart complements this narrative, painting a vivid picture of the diversity in hobby preferences across ages. Remarkably, reading appears as a constant passion across all age segments. While sports captivate the attention of the younger generation, painting gains prominence among the more mature. The allure of cooking and gardening strengthens among the older age groups.
In conclusion, these graphs vividly illustrate the interplay between age and hobbies. The line graph conveys the gradual decline in weekly hobby time as individuals mature, while the bar chart highlights the ever-evolving palette of interests, underscoring the universal joy of reading and the diverse charms of sports, painting, cooking, and gardening in different stages of life.

