- IELTS WRITING TASK 1 -LINE GRAPH & BAR CHART
Residential Energy Consumption Analysis and Appliance Usage (2022)
You should spend about 20 minutes on this task.
Task:
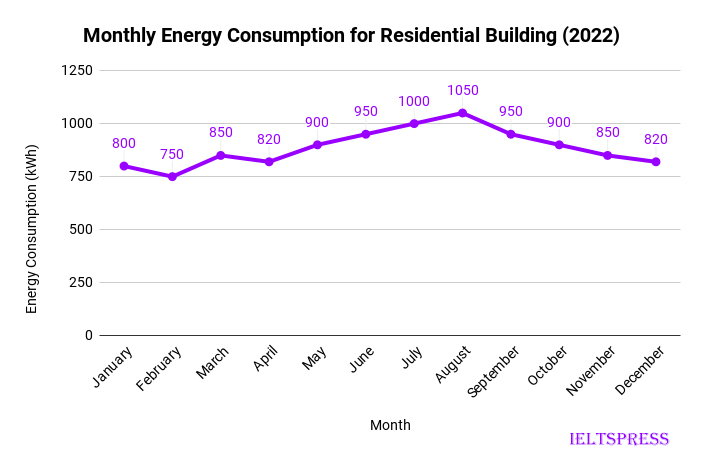
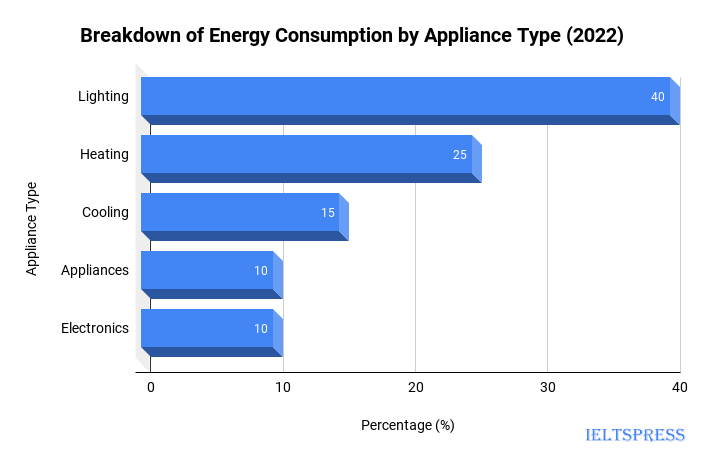
The provided data presents the energy consumption patterns of a residential building throughout a year. The line graph displays the monthly energy consumption in kilowatt-hours (kWh), while the accompanying bar chart demonstrates the distribution of energy consumption by appliance type. Summarize the trends and key observations from the line chart and bar chart.
Write at least 150 words describing the main trends and comparisons shown in the graphs.


Sample Answer, C1 English Level, Advanced, Band Score 6.5-7.5
The graphs provide insights into a residential building’s energy usage over the span of a year. The line graph shows the changes in energy consumption from month to month, while the bar chart gives an overview of how different appliances contribute to the total energy use.
From the line graph, it’s evident that energy consumption varies across the year. Months like July and August have higher energy usage, reflecting the need for cooling systems during the hotter summer months. Conversely, energy consumption is lower in milder months like April and December.
The bar chart breaks down the energy consumption by different appliance types. Lighting is the largest contributor, accounting for 40% of the total energy use. Heating follows at 25%, indicating its significance. Cooling, appliances, and electronics contribute around 10-15% each.
In conclusion, the graphs reveal a pattern of higher energy consumption during hotter months and lower usage during milder months. Lighting and heating are the main contributors to energy consumption, underscoring the importance of energy-efficient practices in residences.
The graphs offer a view of how a residential building uses energy throughout the year. The line graph shows changes in energy use each month, while the bar chart presents which appliances contribute most to the energy consumption.
Looking at the line graph, we can see that energy use goes up and down over the year. Months like July and August use more energy, likely because of air conditioning during hot weather. On the other hand, energy use is lower in months like April and December when the weather is milder.
The bar chart helps us understand which things use the most energy. Lighting is the biggest at 40%, and heating is next at 25%. Cooling, appliances, and electronics each use around 10-15% of the energy.
In conclusion, these graphs show us when energy use is higher and lower in a year. They also tell us that lighting and heating are the main things that use energy in a home. It’s a reminder to be mindful of our energy use, especially during hot months.
The graphs give us an insightful view into the energy consumption patterns of a residential building throughout a year. The line graph illustrates the changes in energy usage from month to month, while the bar chart provides an overview of how different appliances contribute to the overall energy consumption.
Looking at the line graph, it’s apparent that energy consumption undergoes fluctuations over the year. The months of July and August stand out as periods of heightened energy use, which aligns with the need for increased cooling during the hotter summer months. In contrast, energy usage dips during months like April and December when temperatures are milder.
The bar chart enhances our understanding of the distribution of energy consumption by appliance type. Lighting commands the largest share at 40%, followed by heating at 25%, signifying their significant roles. Cooling, appliances, and electronics each contribute around 10-15% to the overall energy consumption.
In conclusion, these graphs provide valuable insights into the dynamics of energy consumption within a residential setting over the course of a year. The line graph showcases seasonal fluctuations, and the bar chart underscores the pivotal role of lighting and heating in the overall energy usage.

