- IELTS WRITING TASK 1 -LINE GRAPH & BAR CHART
Smartphone Usage Patterns Across Age Groups (2022)
You should spend about 20 minutes on this task.
Task:
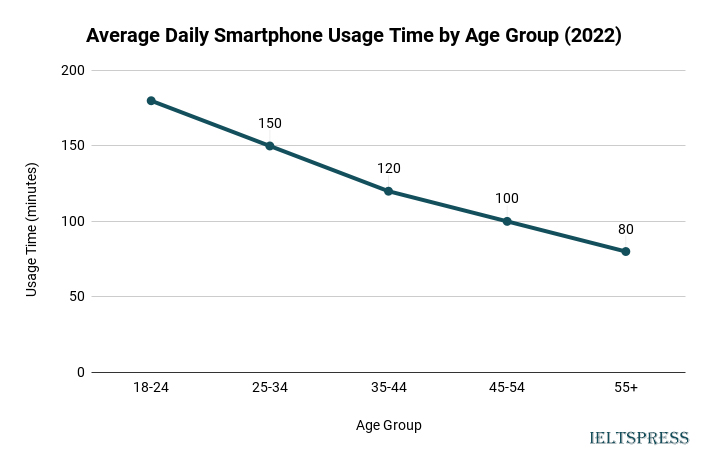
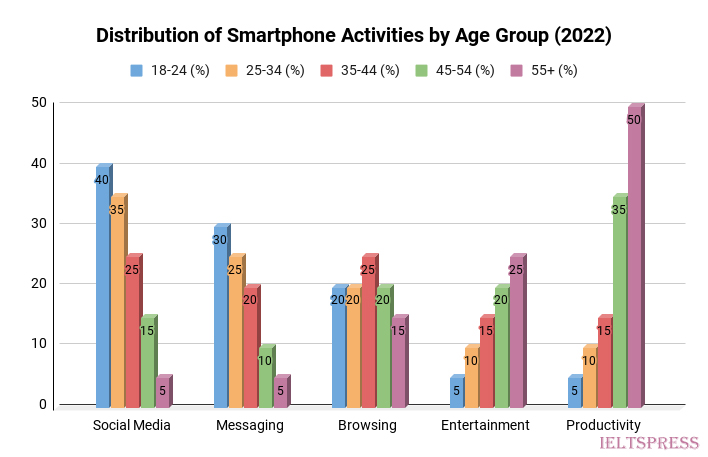
The data provided offers insights into the smartphone usage habits of different age groups. The line graph illustrates the average daily usage time in minutes for each age group, while the accompanying bar chart displays the distribution of smartphone activities across these age groups. Summarize the trends and key observations from the line graph and bar chart.
Write at least 150 words describing the main trends and comparisons shown in the graphs.


Sample Answer, C1 English Level, Advanced, Band Score 6.5-7.5
The graphs provide a glimpse into how different age groups use smartphones. The line graph shows how much time each age group spends on smartphones each day, while the bar chart presents what they do on their phones.
From the line graph, we can see that younger people, aged 18-24, use smartphones the most, with an average of 180 minutes per day. As people get older, the time spent on smartphones decreases, with those aged 55 and above using them the least, about 80 minutes per day.
Looking at the bar chart, it’s clear that younger people use their phones more for social media and messaging. Browsing and productivity activities are more evenly distributed across age groups, while entertainment and productivity activities become more popular with age. The 45-54 and 55+ age groups use smartphones more for entertainment and productivity compared to the younger groups.
In conclusion, the graphs reveal interesting trends in smartphone usage among different age groups. Younger people spend more time on their phones and focus on socializing, while older people use their phones for a mix of activities, including staying entertained and being productive.
The graphs show how different age groups use smartphones in terms of time spent and activities. The line graph displays the average daily usage time for each age group, while the bar chart reveals the types of activities they engage in.
From the line graph, we can observe that younger individuals, aged 18-24, use smartphones the most, with around 180 minutes per day. As the age groups increase, daily usage time gradually decreases, reaching about 80 minutes for those aged 55 and above.
Analyzing the bar chart, it’s apparent that younger age groups, particularly 18-24 and 25-34, focus more on social media and messaging. Browsing and productivity tasks are spread out across all age groups, while entertainment and productivity activities gain prominence as age increases, with the 45-54 and 55+ groups embracing them more.
In conclusion, the graphs illustrate how smartphone usage varies across different age groups. Younger individuals use smartphones extensively, especially for social interactions, whereas older age groups shift towards entertainment and productivity. This data gives insights into the diverse preferences and habits among various generations.
The presented graphs shed light on the distinct patterns of smartphone usage across various age groups. The line graph outlines the average daily usage time, while the bar chart delineates the predominant smartphone activities among these groups.
Observing the line graph, it becomes evident that the younger generation, aged 18-24, dedicates the most time to smartphone use, with an average of around 180 minutes per day. As age progresses, this usage time declines, reaching approximately 80 minutes for those aged 55 and above.
The bar chart, on the other hand, unravels the particular preferences within different age segments. Social media and messaging activities are most prevalent among the younger age groups, notably 18-24 and 25-34. The distribution of browsing and productivity activities is relatively uniform across age brackets. Interestingly, the older age groups, particularly 45-54 and 55+, display a growing inclination toward entertainment and productivity activities.
In summary, these graphs illuminate the intricate tapestry of smartphone usage habits within distinct age groups. The younger generation is at the forefront of smartphone engagement, gravitating towards social interaction, while the older age segments shift towards entertainment and productivity, painting a dynamic portrait of technology adoption across generations.

